

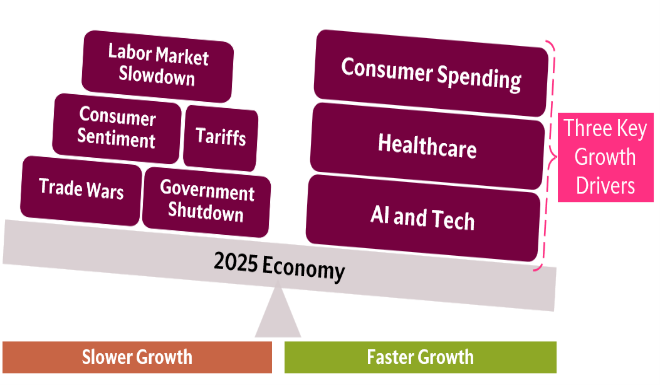
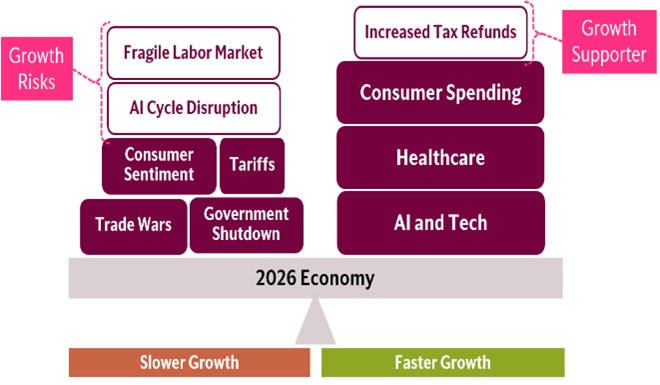
As we look to 2026, The Hartford’s Global Insights Center is of the view that the U.S. economic outlook will likely be driven by the direction of consumption, artificial intelligence (AI), and healthcare. These may emerge as the three main themes and macro factors shaping the U.S. economy in the year ahead. AI, however, could also present some headwinds, which we will discuss throughout this report. Other areas matter as well, such as housing, which we will also address.
Watch the Consumer, AI, and Healthcare
To start, we anticipate labor conditions to remain soft, a continuation of a theme we highlighted in 2025. This implies slower than trend job creation, a slight increase in the unemployment rate, and wage inflation may decelerate but remain elevated relative to prior years. We believe wage pressures may be driven by labor availability, based on our analysis of demographic trends.
Inflation may remain under pressure, particularly in the first half of the year, as tariff pass through effects continue. However, we are unlikely to see inflation rise as significantly as it did in 2022.
Collectively, consumption may remain robust. While not at the levels observed in the third quarter of 2025, consumer spending may continue to grow even if consumer sentiment remains subdued. Fiscal policy could emerge as a key variable; tax cuts from the 2025 spending bill may boost consumption in the first half of the year due to tax refunds.
Healthcare has emerged as a key driver of economic growth in recent years and now represents a substantial share of the overall economy. We expect this trend to continue due to demographics, making healthcare a sector to watch. In contrast, growth in residential construction spending may be flat, in part due to demographic trends, and home prices may see limited appreciation.
AI is expected to attract continued investment in both infrastructure and software. After healthcare, AI was a leading driver of economic expansion in 2025 and will likely remain so in 2026, with an added focus on energy related investments. However, there are risks: if the AI growth narrative weakens, it could become a headwind for broader economic growth.
Overall, given our expectations for above trend consumption growth, continued expansion in healthcare spending, and sustained investment in AI and energy, our view is that the U.S. economy will likely show positive growth in 2026. Growth may be slower than in 2025, but positive momentum should persist. That said, risks remain that could alter this outlook, and we discuss those in this report as well.
 |
 |
Inflation, Labor, and How They May Collectively Support Consumption (With Some Caveats)
Softening Job Market Likely to Continue
Labor conditions weakened throughout 2025, a trend we highlighted early in the year. Based on the Bureau of Labor Statistics (BLS), job growth averaged 55,000 per month, down from 168,000 a year earlier. The unemployment rate rose to 4.4% by December, up from 4.0% at the start of the year. Average wages grew 3.8% at the end of the year, slightly slower than the previous 4.0% pace. While wage inflation remained above trend, though slightly dampened, it was likely influenced by labor availability constraints.
Job growth was slow and concentrated in a narrow set of industries. Healthcare outperformed, adding 63,000 jobs per month. Construction, restaurants, and retail also posted modest gains.
The largest job losses occurred in manufacturing, logistics, business support services, and federal government agencies. Manufacturing and logistics faced challenging business conditions in part because tariffs increased production costs and reduced import volumes. Some business support functions, such as customer service call centers and graphic design firms, were likely affected by AI driven disruption. Meanwhile, federal agencies reduced headcounts through layoffs, closures, and contract buyouts.
Overall Labor Availability May Continue to Decline
Beyond industry dynamics, job growth was likely constrained by declining labor availability driven by slower immigration and an aging population. In past decades, each retirement was typically backfilled by multiple younger workers, expanding the talent pool. Over the coming decade, however, there may be only one younger worker per retirement, which could cause the domestic talent pool to grow slowly. See our national demographic outlook and state outlook.
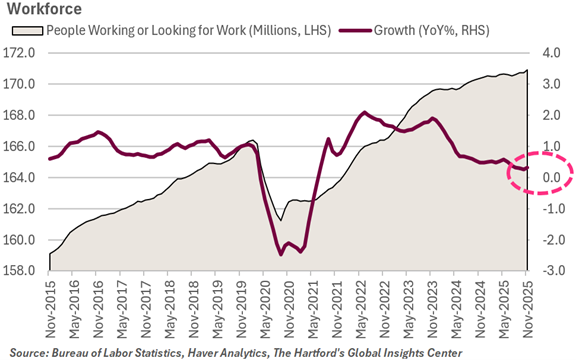 The 2026 job market is likely to resemble 2025 and continue to soften. This implies a slightly higher unemployment rate and weaker labor demand outside select sectors such as healthcare, which will likely continue to require additional workers. AI could disrupt more industries, while low immigration could limit hiring potential in agriculture, transportation, and food services.
Accordingly, wage inflation may remain above trend, although decelerating from 2025 levels.
However, upside risks to labor conditions include:
- Stronger‑than‑expected demand for healthcare workers, driven by demographic aging.
- Increased demand for construction labor tied to expanding AI data‑center development, semiconductor fabrication facilities, and advanced manufacturing plants.
Inflation Picked Up in the Second Half of 2025 and Is Likely To Persist Into Early 2026
Inflation improved for most of 2025. The Consumer Price Index (CPI) averaged 2.5%, down from 3.0% in 2024 and well below the 9%+ peak of 2022.
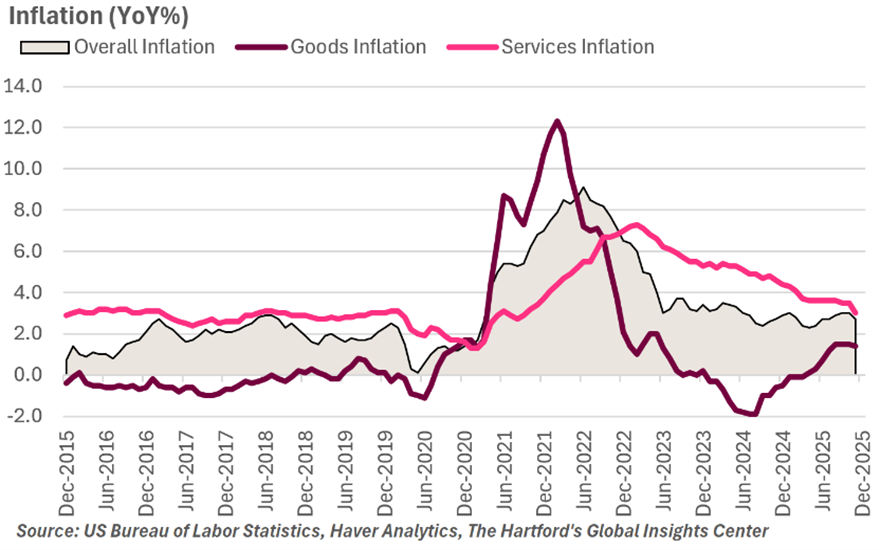 Most disinflation occurred in the first half of the year. By late summer, however, inflation began rising again, partly due to goods inflation, which reached 1.5% by mid‑to‑late 2025. While not historically high, and well below the 12.1% surge seen during the 2021–2022 supply‑chain disruptions, this level is above the long‑term trend. For decades, inexpensive imports kept goods prices flat; the basket of goods purchased in 2019 cost roughly the same as in 1999. That changed in 2025, when tariffs made imports more expensive.
Despite rising goods inflation, falling gasoline prices and slower‑than‑usual rent growth helped contain headline inflation.
Our base case is that inflation may remain above the Fed’s 2.0% target for much of 2026, though it is unlikely to become unanchored.
Variables Shaping the Inflation Outlook: Wages and Tariffs
Slower wage growth, as discussed earlier, could dampen inflation by reducing demand pressures. In addition, flattening home‑price appreciation and moderating rent increases, which began at the end of 2025, may also slow headline inflation.
Conversely, inflation could rise above expectations if:
- Businesses accelerate tariff pass‑through to consumers.
- New tariffs are implemented.
- Last year’s tax cuts increase disposable income and drive higher demand for goods.
The main wildcard will likely be energy. Oil prices were subdued throughout 2025, despite geopolitical turmoil, helping cap what could have been higher inflation readings. Whether geopolitical tensions ultimately affect energy prices in 2026 remains a critical risk to monitor.
Pessimism Is Elevated, but Consumption Remains Strong
Turning now to consumption and how labor and inflation dynamics interact. Consumer confidence was weak in 2025. According to the University of Michigan Consumer Sentiment Index, pessimism was comparable to levels seen during the recessions of 2020, 2008, and 1980, even though the economy was nowhere near recession.
This pessimism likely reflected a deteriorating job market, longer job‑search durations, declining savings rates, shrinking bank balances, and rising credit‑card debt for some households. Yet despite negative sentiment, consumer spending remained robust. Consumption grew 2.8% through Q3 2025 based on the Bureau of Economic Analysis (BEA), a strong pace.
Spending was supported in part by income growth outpacing inflation, giving households real spending power. Based on our calculations, wealth also likely increased substantially: total U.S. net worth likely rose USD 57.5 trillion over five years, aided by an 82.6% stock market increase and a 39.3% rise in home prices.
As wealth grows, households likely spend 4–5% of their gains, a phenomenon known as the wealth effect, also based on our calculations. This contributed a potential USD 2.6 trillion in additional spending over five years, largely concentrated among more affluent households.
Looking ahead, consumers will likely spend more in 2026 in absolute terms, but the rate of growth may slow. Consumption is expected to remain firm, though the pace of expansion may flatten.
Tax Cuts Could Boost Spending More Than Expected, While Labor Could Turn Into a Headwind
Potential upside risks to consumption include:
- Tax cuts from the 2025 budget bill (e.g., higher deduction caps, accelerated depreciation), which may reduce household tax burdens in 2026 and support early‑year spending.
- Faster‑than‑expected interest‑rate cuts.
On the other hand, if labor conditions weaken more quickly than anticipated, causing wage growth to slow materially, household spending could soften. Additionally, if inflation rises above expectations, household real purchasing power may erode.
Finally, the equity market could be a wildcard. As noted earlier, market gains have fueled significant spending via the wealth effect. A reversal in equity performance could produce the opposite outcome.
Housing Market Likely to Flatten
Home Price Increases Are Starting to Moderate
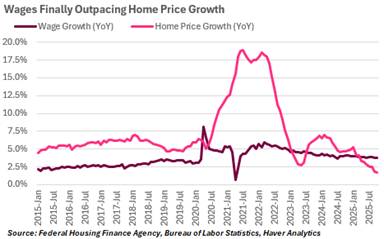
Another driver of weak consumer sentiment may be the cost of housing and related affordability concerns. In the decade leading to 2025, home price growth exceeded wage growth for most Americans, indicating that the cost of housing was consuming a larger share of earnings. However, this began to improve over the last year, with home prices decelerating and falling below wage growth, resulting in an improvement in affordability.
 It’s likely that in 2026 this trend will continue, with gradual improvement in affordability as the housing market approaches more normal conditions after pandemic‑era disruptions of tight supply, low transaction volumes, and rapid price growth. Nationwide home prices are likely to remain flat in the year ahead, though with significant regional variation, while new home construction may also remain below prior years. It could take many years of this pattern to fully address affordability challenges, however.
New Home Segment Is Seeing Lower Price Points Than Existing Homes
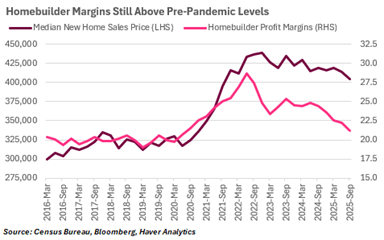
Within the new home category, sales prices peaked in 2022 and have declined by about 5.0% since then. The inventory of new homes completed and available for sale has grown and now stands at the highest level since 2009. This inventory theoretically puts downward pressure on new home prices. In fact, average new home prices are now lower than existing home prices, which is historically unusual, as one would expect newer homes to sell at a premium. Furthermore, newer homes are, on average, larger than prior‑generation homes, which would typically command a higher price. Counteracting this is the location of newly constructed homes; new homebuilding at times takes place on the outskirts of metropolitan areas, so new homes have longer commute times than existing homes.
 As price increases flatten, we also anticipate new home construction to remain soft in the coming year. Some of this may be attributed to ongoing weakness in demand due to a combination of affordability challenges and borrowing costs.
On the building‑cost side, development expenses remain generally under control despite tariffs and labor shortages. Softening demand for building materials likely partially offset upward pressure from tariffs, leaving the cost of materials up only slightly in 2025. Soft demand has also kept labor costs in check, even with reductions in immigration in this sector, as construction wage inflation has remained comparable to overall wage inflation.
Existing Home Prices Likely To Remain Stable
We anticipate existing home prices to remain roughly flat during 2026 for several reasons. The first is competition from cheaper newly constructed homes, as noted above. With inventories of new homes up and prices down, this competition could limit the ability of home sellers to raise prices.
Inventories of existing homes also increased somewhat in 2025, and further increases are expected in 2026. More homes available for sale could reduce competition between buyers.
Affordability may also limit significant upward pressure on existing home prices. With home prices having increased rapidly for so long, consumers often stretch their budgets to afford a home. While wage growth should slowly improve affordability, uncertainty in the labor market could keep some potential buyers on the sidelines. A gradual lowering of interest rates in 2026 may also occur, which could lower mortgage rates supporting the cost of future ownership.
Regional Disparities Likely To Continue
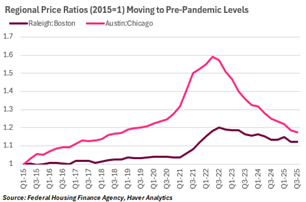 The slowdown in home price growth in 2025 was largely driven by declines in the South and West, while prices in the Midwest and Northeast rose throughout the year. The South saw rapid price growth after the pandemic as domestic migration accelerated, boosting demand for housing in that region. However, the price growth eventually undercut the price advantage of moving to the South. Migration and population growth in the Southern states continue, but they are not translating into excessive housing demand relative to available supply, given the surge in construction activity in prior years. Accordingly, price increases in this region have slowed.
Rental Market May Soften After Years of Rising Rental Rates
The rental market may see increased affordability as monthly rental growth has flattened, and, in some cases, declined. Apartment vacancies remain elevated, and the higher levels of multifamily construction seen over the past few years may continue to supply newly completed multifamily buildings to the market. The combination of higher vacancies and limited home price appreciation could keep monthly rent rates in check for renters. While rent metrics used in official inflation reports show slowing growth, some alternative measures actually show rents declining.
Outlook for Housing Expected To Continue To Slow
Over the longer term, based on the Global Insights Center’s demographic projections, we expect underlying demand for new homes to average just under 1 million per year through 2030. This is down from an average of about 1.3 million homes per year since 2010. Two countervailing trends are at work: slowing population growth, which reduces the growth rate of housing demand, and an aging population, which supports demand through smaller household sizes.
The demand for new homes does not correspond directly to housing starts, because some new construction replaces existing homes (teardowns) rather than adding to the housing stock. Homes are not generally portable, so domestic migration can also lead to new construction needs that exceed underlying demand. There is also a shortage of at least a million homes that can be worked down by higher levels of housing starts than underlying demand. There were about 1.35 million housing starts in 2025. A gradual decrease in housing starts is still likely to result in housing production outpacing underlying demand, allowing some reduction in housing shortage.
Healthcare Spending Expected to Grow Further and Increase its Share of the Economy
Healthcare’s Share and Role in the Economy Are Likely To Grow Further
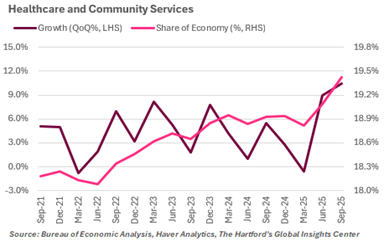 The healthcare sector is a key part of the US economy, accounting for 19.4% of overall GDP and 17.4% of all private‑sector jobs. Furthermore, its importance to the economy is only growing. In 2025, when combined with community services (which include health‑adjacent fields such as disability and rehabilitation services), healthcare accounted for 41.4% of GDP growth and an astonishing 97.1% of private‑sector job growth, based on the Global Insights Center’s calculations. There are several factors suggesting healthcare could continue to grow as a share of the economy and remain a driver of overall economic growth in 2026, though a few headwinds should be noted.
Demographics and Medical Advancements Likely To Support Sectoral Growth
Certain long‑run drivers of healthcare growth could remain intact in 2026. Demographic change is increasing the number of elderly Americans, who on average consume more healthcare per person than younger individuals. In 2026, the number of Americans aged 65 or older is expected to grow by about 1.7 million, or 2.7%. With health expenditures that are, on average, double those of individuals under age 65, the demographic shift alone should drive rising demand for healthcare.
Immigration and Other Forms of Government Policy Could Offset Growth Expectations
 However, there are some potential headwinds to consider. While population aging is a demographic tailwind, slower overall population growth driven by lower levels of immigration could limit increases in aggregate healthcare spending.
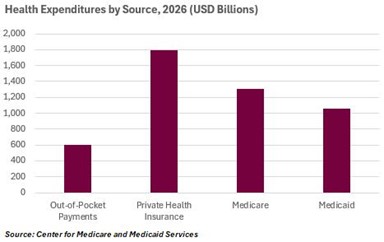
Changes in government healthcare spending also present a potential headwind. The two main Federal healthcare programs, Medicare and Medicaid, may become more important due to the population aging and Medicaid expansions; in 2026, they are expected to account for as much health spending as private insurance and out‑of‑pocket payments combined. Congress passed large cuts to Medicaid in 2025, but most do not take effect until 2027, so the impact on 2026 may be limited. However, the expiration of enhanced subsidies for the Affordable Care Act (Obamacare) could reduce federal healthcare spending if not reversed (congressional negotiations for a partial extension are ongoing). This could potentially be offset by a combination of (1) consumers redirecting more spending toward healthcare and (2) reduced consumption of healthcare services due to loss of insurance coverage.
The AI Investment Supercycle and Energy Investments
AI Investment Extends Beyond Tech and Is a Major Contributor to US Economic Growth
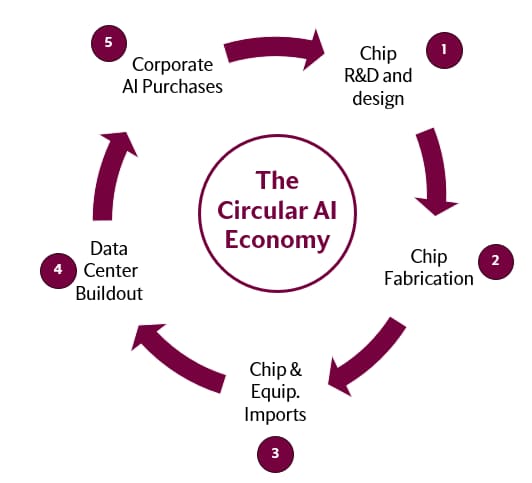
Investment and spending on AI have been a significant source of broad economic growth in 2025, and this trend is expected to continue in 2026. Importantly, the scope of US investment in AI infrastructure is broader than just spending on semiconductors, other tech hardware, and software. It also encompasses investment in building new data centers and meeting their needs for water and power. In total, we estimate the AI investment accounted for about a third of US GDP growth in 2025 when including both business and consumer spending on AI and tech.
Data from the Bureau of Economic Analysis shows spending on construction of data centers in the US has more than doubled since late 2022. It likely topped USD 40 billion in 2025 and is on pace to exceed annual construction outlays on office buildings.
Energy and Data Centers Are Increasingly Intertwined
 The surge in data center construction has also coincided with a surge in investment in new power. Annual spending on electric power construction increased 30%, from USD 90 billion in 2023 to almost USD 120 billion just two years later in 2025.
The investment boom in data centers and power generation is likely to be a durable macro trend in 2026. Data centers currently account for about 8% of total US power demand, according to S&P Global, and this figure could grow to over 10% by 2030, roughly equivalent to the annual consumption of California and New York State combined. In response to this increased demand, the Edison Electric Institute (an industry research group) estimates publicly owned utility companies will spend over USD 1 trillion between 2025 and 2029 to boost power generation and expand electric grids.
There are instances, however, in which new power projects take time to actually be connected to the grid. The extended wait times could slow the completion of new projects. But overall, we anticipate growth in power and energy construction expenditures.
Data center operators are responding to these challenges in a few ways. First, they are in some instances choosing to locate new data centers in areas where power capacity is currently available, or at re‑purposed industrial sites with existing connections to the power grid. Second, some are turning to on‑site captive power generation via either natural gas or renewables.
There Are Some Risks To Consider Too for the AI Infrastructure Story
Some of the risks that could affect the AI story stem from events that could disrupt the availability of semiconductors or supply chains. These include potential geopolitical or even weather‑related events affecting Taiwan, which is a key source of semiconductor production.
There could also be potential disruptions related to the availability of labor and financing needed to build out future data centers.
Despite these potential risks, multiple factors could continue to drive strong AI investments in 2026. For example, overall capital expenditures by the four largest tech firms may grow by 25% and exceed USD 500 billion in 2026, according to leading investment banks. Accordingly, this may translate into ongoing expenditures for data centers. We believe construction spending is poised to grow further in 2026, given the sheer number of projects in the pipeline. Furthermore, spending on power construction is expected to grow by more than 10% and could reach USD 150 billion, representing a 50% increase from 2023 levels.
This article provides general information, and every effort has been made to ensure accuracy of the information contained herein. In no event will The Hartford be liable for direct, special, incidental, or consequential damages (including, without limitation, damages for loss of business profits, business interruption, loss of business information or other pecuniary loss) arising directly or indirectly from the use of (or failure to use) or reliance on the information contained herein, even if The Hartford has been advised of the possibility that such damages may arise.
Links from this site to an external site, unaffiliated with The Hartford, may be provided for users' convenience only. The Hartford does not control or review these sites nor does the provision of any link imply an endorsement or association of such non-Hartford sites. The Hartford is not responsible for and makes no representation or warranty regarding the contents, completeness or accuracy or security of any materials on such sites. If you decide to access such non-Hartford sites, you do so at your own risk.